A statistical strategy I've been working on.
In this case it is based on looking at the volatility of SP500 options, 30 days ahead of time. (ViX)
The reason for using the implied volatility of options is to determine if the market sees any heightened risk in terms of future market decline.
In the chart below, the pink-line resembles the returns of the SP500-index, and the blue line resembles the ViX-index. ViX is an index that measures the 30-day implied option volatitilities of the SP500 as the underlying.
The ViX is in essence the annualized standard-deviation of the SP500.
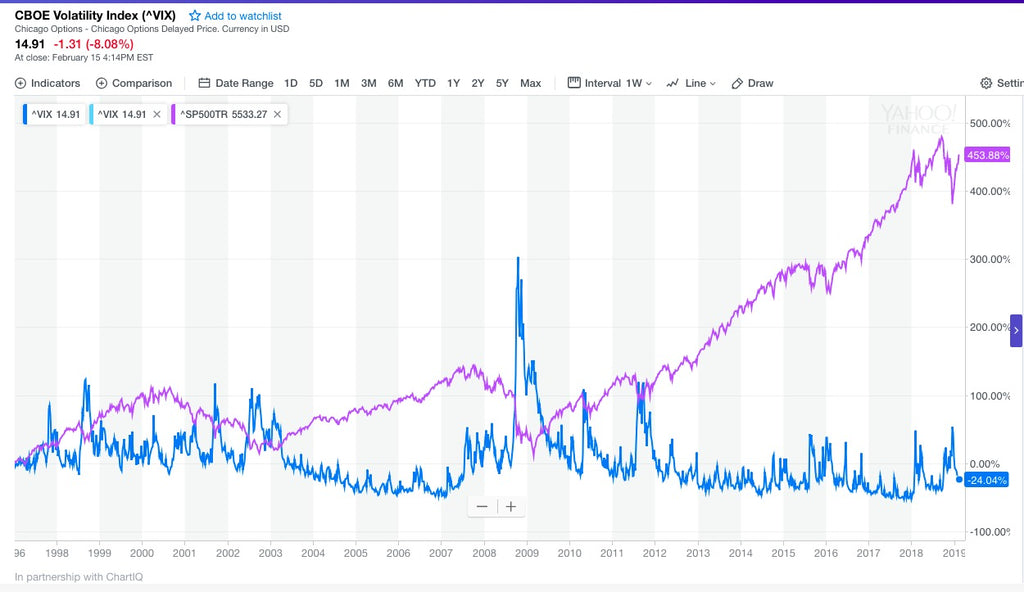
Graphically, you'll notice that when the SP500 drops, as in the crisis of 2008, the Greek-debt crisis and its associated bailouts 2011-2012, the ViX tends to shoot up sharply, which indicates that the SP500 fell in value.
Similarly, when the ViX is low, in the ranges of 10-13, the market is in an up-trend, as the markets doesn't see any risk of market decline.
A good rule of thumb is to remember that when the ViX is low, 10-13, the markets are UP-trending, and when the ViX is high (20+), markets decline.
Intuitively, by studying the graphical nature of the SP500 & ViX one sees that an inverse relationship emerges between the two.
Market participants determine what risk is by looking at the fundamentals and the macroeconomic environment, we're in. Thus it is important to analyse the interest-rate environment we're in as it affects volatility levels, in tandem with incoming macroeconomic data to determine fundamentals giving rise to different market conditions and the level of the ViX.
From a trading-perspective it is also important to know how wide our stop-loss needs to be, which can be done by calculating the daily ranges of the SP500, by using the ViX as a basis in order to get the daily standard deviation.
So, statistically speaking. If the ViX is @ say 13.
Then you can calculate the daily standard deviation, by taking 13/15.85= 0.82%.
(15.85 is the square root of the amount of trading days in a year, approximately 252*).
So given the 68–95–99.7 rule and the calculation we just made we see that 0.82% is in the first standard deviation.
The second standard deviation can be calculated by taking 0.82% x 2 = 1.64%.
Third standard deviation can be calculated by taking 0.82% x 3 = 2.46%.
In practical terms these calculation mean that the SP500 will have a daily standard deviation/range that is 0.82% - 68% of the time, and 2 standard deviations 95% of the time and 3 standard deviations 99.7 of the time.
Likewise, the probability for the daily range of the SP500 to close within 2 standard deviations can be calculated by taking 95 - 68= 27%
Similarly, the probability for the daily range of the SP500 to close within 3 standard deviations can be calculated by taking 99.7- 95= 4.7%
I chose to backtest (1 year worth of data*) the formulae of taking the daily ViX-value, divided by 15.85 in order to determine how often the daily SP500 % - change falls in line with the results we get from the ViX-formulae.
File;
https://cdn.shopify.com/s/files/1/2718/9482/files/vix-sp500_copy.xls?1821151675323079710
We find that the daily % changes of the SP500 fall 77% of the time within 1 standard, using the ViX-formulae.
For 2 standard deviations, the daily % changes fall 98% of the time within 2 standard deviations.
3 standard deviations equal 100% of the daily % changes of the SP500 measured over the entire year period.
An important observation can be inferred from the data; one is that we're seeing a distribution that isn't normally distributed, that could be attributed to the data-period being too short (as it's only 1 year worth of data*).
We could see the 68, 95, 99.7 rule holding over a larger data-set, with periods bigger than 1 year.
In terms of practical use, using the ViX as a market gauge can function as a filter to trade long or short in the underlying SP500 futures contract. Furthermore, given that we know the daily standard deviation, we could utilise this knowledge by applying volatility based stop-losses in a day-trading perspective.